|
|
|
DOW Jones - October 1997
October 31, 2002 4:27 PM , PST
This is how the Double-Repo signal actually forecast the collapse of the Dow one week before the major correction of October 27th 1997.
(Exactly the same scenario was played out almost one year later in July of 1998. Will we see this again in 1999? Will you know what to look for?)
The Double-Repo signal has been presented at TAG, FSI, Futures Symposium International, Futures West, and private seminars around the world since 1987. The next presentation is in Kuala Lumpur (Malaysia) in November 1997.
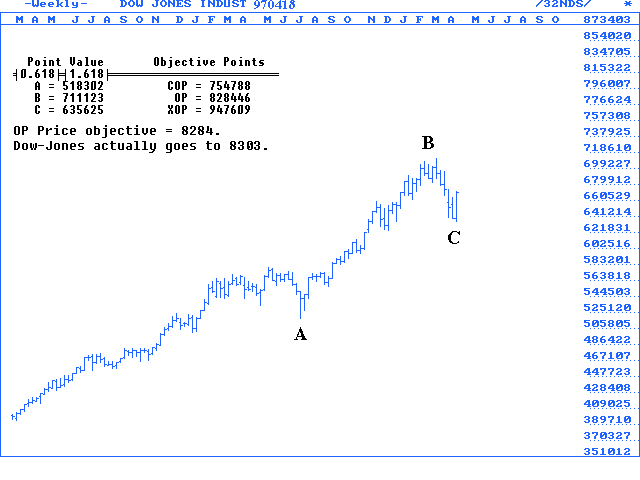
First, some context. The weekly chart is used to calculate major turning points.. The chart below shows how we calculated the Objective Point which was the profit-taking area before the Dow decline..

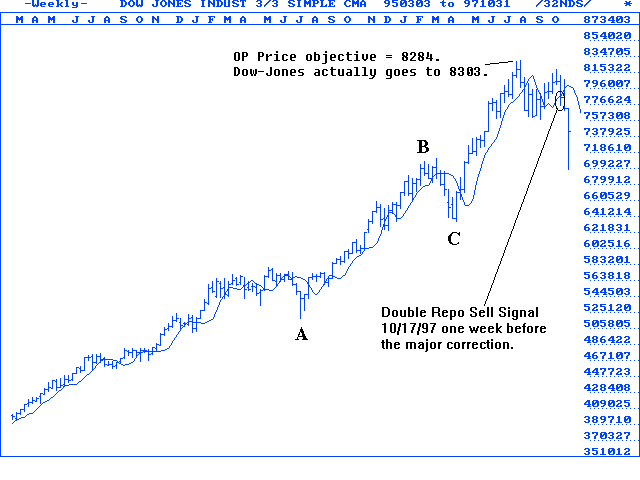
When the dow reached the profit objective, it started forming a classic Double-Repo sell pattern on the weekly chart. Attendees at Mr DiNapoli's TAG seminar in Las Vegas or the Futures West seminars in Burbank during September and October will remember that he mentioned this signal would indicate a major correction of the Dow.
The next chart shows that the Double-Repo sell signal was triggerred one week before the correction.
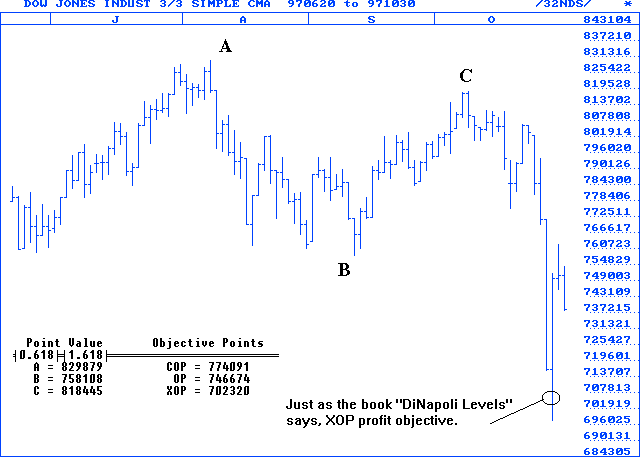
 At that point we had a clear sell signal. So how do we calculate a Logical Profit Objective? Traders who have attended private seminars in the CIS trading room, or studied the DiNapoli taped lessons know the significance of a weekly Double-Repo signal at a major Fibonacci profit objective... A strong move down is predicted, so we calculate the profit level as shown on the next chart.
 Where does the market go from here? That depends on your trading time-frame, but the trend and directional indicators as taught by Mr. DiNapoli are unambigious on the weekly chart....
Why not Get your piece of the trillions of
dollars trades each and every day?
Thousands of investors around the globe use some form of
Fibonacci-related analysis, but few truly understand how to apply the
concepts practically.
- What forces rule the herd instinct?
- Is there an accurate method to measure investor psychology?
- Does a mathematical road map exist that can accurately predict
market sentiment, as well as investor psychology?
- Do you want to emulate the tactics of the real market pros?
After digesting Trading With DiNapoli Levels:
- You will be able to determine your own forecasts.
- You will be telling your broker what to do, if you bother keeping
him around.
- You will have the tools to pre-calculate strong and reliable area
of support, and resistance in stocks, bonds, options, or futures
Will you be ready for the next crash? Or will you become roadkill!
In this book, Joe DiNapoli shows you how his brand of Fibonacci
Analysis (D-Levels) accurately predicted the bottom of the 1987, 500+
point down day, almost to the tick!
If that's not enough to get your attention, he also shows the same
theory related to the recent trough in Californian real estate prices!
Has he rested on his laurels? Absolutely not!
Weeks before the second 500 point down day that occurred in late
October ('97), Joe DiNapoli wrote an article during a speaking event in
Asia that was posted on his web page (www.fibtrader.com) It was about the
real conditions that existed in Southeast Asia. This was well
before you heard the television commentators and our political leaders
disclosing the truth about the situation. Exactly one week before
the second 550 point down move, on October 27th, one of Joe
DiNapoli's most reliable signals (the Double RePo), covered in Chapter 6,
Directional Indicators, formed in the Dow Jones Industrial Average. It
gave a clear weekly based sell signal which resulted in the biggest one
day point drop in history and almost an 1100 point down move in the
subsequent five days!
Before...

Page 9 The exact precalculated DiNapoli level profit objective, (covered in Chapter 8, Logical Profit Objectives) was hit!

Additional charts and Comments by DiNapoli expert Kevin Riordan. See the Client Forums
|


 Seminar
  Software
  Subscriptions


 Seminar
  Software
  Subscriptions


